 Microsoft Excel is one of the most powerful and versatile tools available to businesses today. From data analysis to financial modeling, Excel’s capabilities extend far beyond basic spreadsheet functions. Its wide array of features makes it an indispensable tool for professionals across various industries. Let’s explore how you can learn Microsoft Excel to drive efficiency, productivity, and informed decision-making.
Microsoft Excel is more than a spreadsheet tool. It can transform the way you work and the way you understand data. As you learn Microsoft Excel, you’ll see how it can support better decisions and smarter planning.
Excel offers features that help you track, manage and analyze data quickly. Therefore, you can spend more time on what matters most. Additionally, Excel’s tools can handle everything from financial models to customer data. This makes your daily work easier and more efficient.
Moreover, Excel’s advanced functions provide reliable solutions for complex tasks. With the right formulas, you can make sense of large data sets. As a result, you’ll find new ways to solve business problems and improve outcomes. Excel also supports better communication by turning data into clear visuals. This helps your team share ideas with confidence.
When you use Excel for project management, you’ll find it easier to stay on track. It helps you keep projects organized and moving forward. Additionally, Excel’s ability to handle inventory data supports better forecasting. You can reduce costs and respond faster to market needs.
Learning how to use Excel’s advanced features takes your skills to the next level. However, it’s worth the effort. You’ll find that Excel has the flexibility and power you need to support your work. With Excel as part of your toolkit, you’ll be ready to handle any business challenge that comes your way.
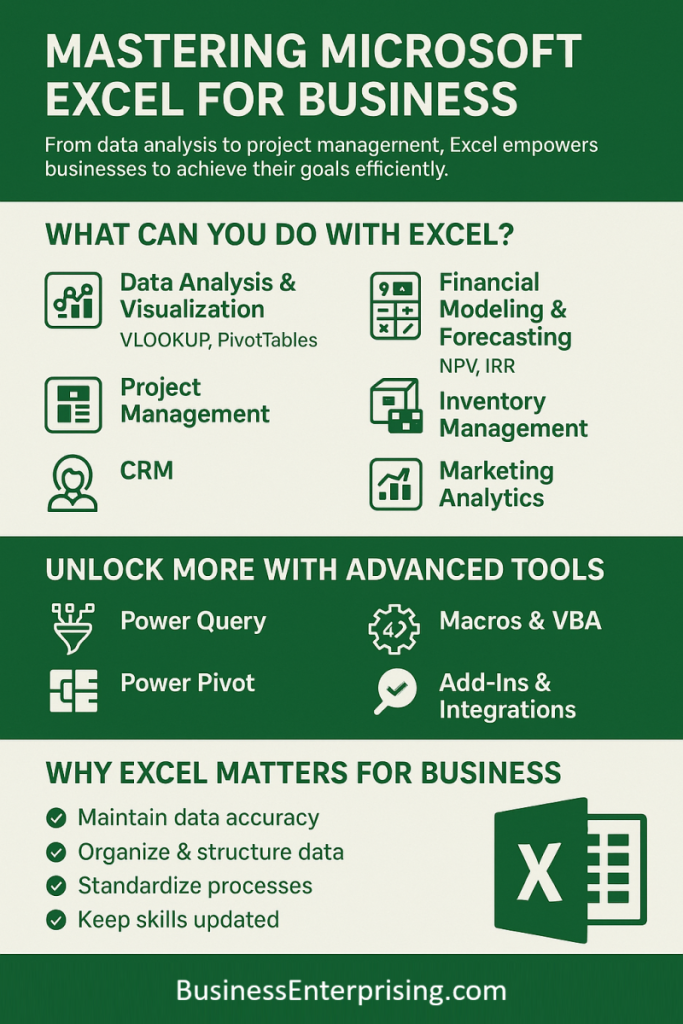
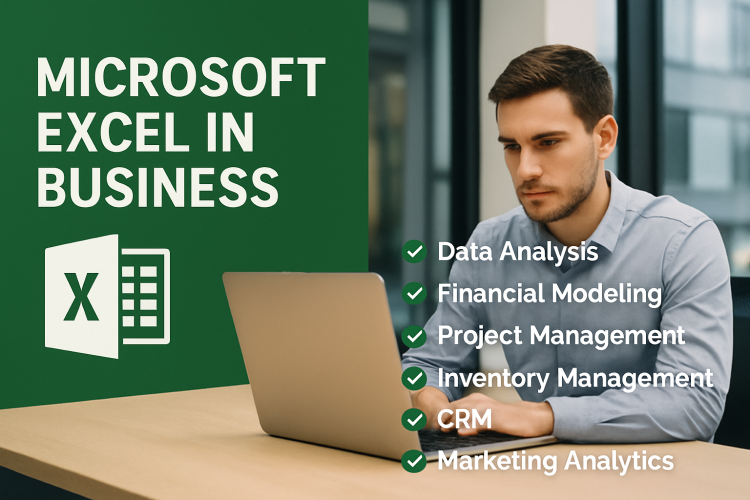
Key Uses of Excel in Business
Data Analysis and Visualization
Excel’s robust data analysis tools allow businesses to process large volumes of data efficiently. In fact, functions such as VLOOKUP, HLOOKUP, and PivotTables enable users to sort, filter, and summarize data seamlessly. As a result, they provide valuable insights that drive smarter decision-making. Moreover, Excel offers a variety of data visualization options, including bar charts, line graphs, pie charts, and scatter plots. These visual tools, in turn, help present data in a clear and visually appealing manner. Consequently, it becomes much easier to identify trends and patterns that inform business strategies and enhance overall performance.
Financial Modeling and Forecasting
Excel is widely used for financial modeling, providing businesses with the tools they need to create detailed financial plans and forecasts. Specifically, functions such as NPV (Net Present Value), IRR (Internal Rate of Return), and a wide array of financial formulas enable precise financial analysis and more informed decision-making. Additionally, Excel’s ability to handle complex calculations and projections makes it the ideal tool for budgeting and forecasting. Furthermore, businesses can create dynamic models that adjust automatically based on various assumptions and scenarios. As a result, Excel aids significantly in strategic planning, helping companies anticipate challenges and capitalize on opportunities.
Project Management
By learning Microsoft Excel, you can create project timelines, task lists, and Gantt charts that greatly enhance task management. In particular, these tools help project managers track progress, allocate resources, and ensure that projects stay on schedule. Moreover, Excel plays a vital role in resource allocation. It enables managers to track resource availability, allocation, and utilization efficiently. As a result, this ensures that the right resources are used effectively across multiple projects, ultimately improving productivity and project outcomes.
Inventory Management
You can use Excel to maintain accurate records of inventory levels, track stock movements, and manage reorder points. Additionally, formulas and conditional formatting can alert you when stock levels fall below a certain threshold, ensuring that you can take immediate action. Furthermore, Excel is invaluable for demand forecasting. By analyzing historical sales data, businesses can forecast future demand more accurately and adjust inventory levels accordingly. As a result, this helps in minimizing stockouts and reducing carrying costs, ultimately leading to more efficient and cost-effective inventory management.
Customer Relationship Management (CRM)
Excel can serve as a simple yet effective CRM tool, allowing businesses to store and manage customer information, track interactions, and analyze customer behavior. Moreover, Excel plays a crucial role in sales tracking. Sales teams can utilize Excel to monitor performance, track leads, and manage sales pipelines seamlessly. Additionally, dashboards and reports generated from Excel data can provide valuable insights into sales trends and new opportunities, helping teams make data-driven decisions and improve overall sales performance.
Human Resources Management
HR departments can use Excel to maintain detailed employee records, track attendance, and manage payroll effectively. In addition, Excel’s data validation and conditional formatting features ensure data accuracy and consistency, reducing the likelihood of errors. Furthermore, Excel can be utilized for performance evaluation. It allows HR professionals to track employee performance metrics, conduct performance reviews, and analyze workforce productivity more thoroughly. Consequently, this helps in identifying top performers as well as areas that need improvement, fostering a culture of continuous improvement within the organization.
Marketing Analytics
Marketing teams can use Excel to plan, execute, and analyze marketing campaigns seamlessly. In particular, tracking key performance indicators (KPIs) such as click-through rates, conversion rates, and ROI helps teams refine and optimize their marketing strategies. Additionally, Excel’s data analysis tools prove invaluable for market research. They allow businesses to process survey results, customer feedback, and market data efficiently. As a result, businesses are better equipped to make data-driven marketing decisions and tailor their strategies to meet customer needs more effectively.
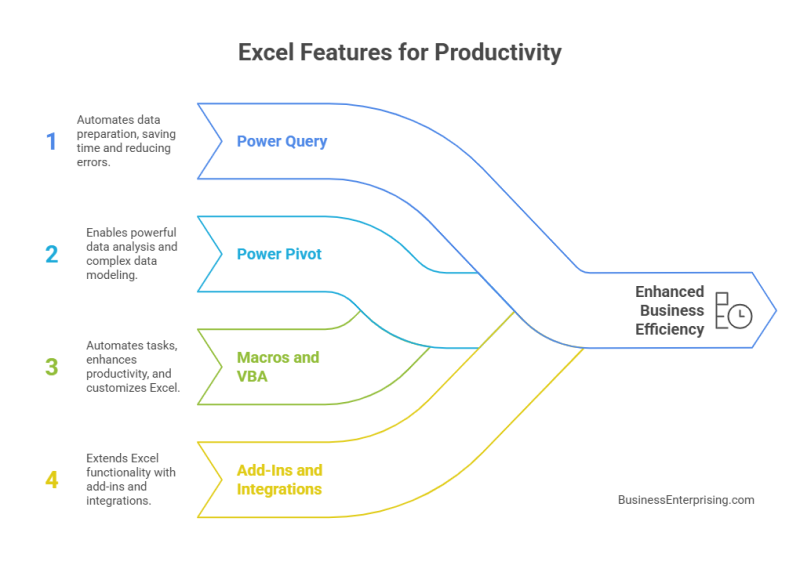
Advanced Excel Features for Business Efficiency
Excel’s advanced features give your business a clear edge. Power Query helps you prepare data quickly by connecting and refining it from various sources. This saves time and reduces errors in your work. Power Pivot lets you analyze large data sets and create complex models. This helps you make smart decisions fast.
Additionally, Macros and VBA are essential tools to automate tasks. You can write scripts to perform repetitive tasks automatically, saving you hours of work. Integrations with tools like Power BI take your data visualization further. These integrations give you clearer insights that drive better results.
Moreover, Excel’s advanced formulas help you manage complex calculations with ease. Features like conditional formatting bring data to life, making trends and patterns clear. Add-ins further expand your options. With these, you can find solutions to complex problems and test multiple scenarios.
These advanced tools in Excel support better planning and forecasting. You can adjust models on the fly to test new ideas and assumptions. As a result, you’ll always have the right data for your next move. Many businesses see better performance when they learn Microsoft Excel’s powerful capabilities.
Excel also makes it easier to keep your data organized and accurate. Advanced features help you spot issues before they become problems. As you explore these tools, you’ll find new ways to get more from your data. In the end, using these features is a smart way to keep your business running smoothly and confidently.
Power Query
Power Query is a data connection technology that enables users to discover, connect, combine, and refine data across a wide variety of sources. This feature automates data preparation tasks, saving time and reducing the risk of errors simultaneously.
Power Pivot
Power Pivot allows users to perform powerful data analysis and create sophisticated data models. It can handle large datasets and complex calculations, providing deeper insights and supporting more informed decision-making.
Macros and VBA (Visual Basic for Applications)
Macros automate repetitive tasks, enhancing efficiency and productivity. VBA allows users to write custom scripts to automate complex processes, customize Excel functionality, and create advanced data manipulation tools.
Add-Ins and Integrations
Excel supports various add-ins and integrations that extend its functionality. For example, integration with Power BI enhances data visualization capabilities, while add-ins like Solver aid in optimization and scenario analysis.
Why Learn Microsoft Excel?
Microsoft Excel is a tool you can use to keep your data organized and your decisions supported by clear facts. It is known for its versatility, helping you create everything from simple tables to complex financial models. Therefore, learning how to use Excel gives you an advantage when working with data.
Additionally, Excel’s many features can help you save time and reduce errors. When you learn Microsoft Excel, you get the power to create clear visuals that make data easier to understand. As a result, your reports and presentations become more impactful and effective.
Moreover, Excel’s tools go beyond simple calculations. With features like PivotTables and charts, you can quickly spot trends and patterns. These insights can help you plan smarter and act faster. Excel also helps you handle tasks like budgeting, forecasting and project tracking with more confidence.
Many professionals use Excel every day to solve problems and improve their work. Therefore, by learning how to use it well, you set yourself up for success. It becomes easier to make data-driven decisions and meet your goals. Additionally, Excel’s features can support you in almost any field.
Excel also lets you customize your work with advanced tools. From macros to add-ins, you can make it work for your specific needs. This flexibility makes it a valuable part of your toolkit. When you take the time to learn its features, you open up new ways to work smarter and more effectively. So, if you want to make better decisions and manage your data with confidence, learning Excel is a great choice.
Maintain Data Accuracy
Ensure that data entered into Excel is accurate and consistent. Use data validation rules and regular audits to maintain data integrity.
Organize and Structure Data
Organize data in a structured format, using clear headers and consistent naming conventions. This makes it easier to analyze and manipulate data.
Use Templates and Standardize Processes
Create and use templates for recurring tasks and reports. Standardizing processes ensures consistency and saves time.
Keep Skills Updated
Regularly update your Excel skills to stay abreast of new features and functionalities. Training and professional development can enhance your ability to leverage Excel effectively.
Learn Microsoft Excel and take advantage of its immense value to businesses across various functions. From data analysis and financial modeling to project management and marketing analytics, Excel’s versatility and robust features make it indispensable. By understanding how to use Excel, businesses can enhance efficiency, drive informed decision-making, and achieve strategic goals.
In short, staying updated with advanced Excel features and best practices ensures that businesses can fully leverage this tool’s capabilities. Whether you’re managing finances, tracking inventory, or analyzing market trends, Excel provides the tools needed to excel in today’s competitive business environment.
Conclusion
Learning advanced Excel skills can help you improve business operations and decision-making. When you learn Microsoft Excel, you gain tools to handle data efficiently. As you use Excel for analysis, you’ll see how quickly it can support better choices. Additionally, advanced features like Power Query and Power Pivot give you more control over data. They also make your work easier and faster.
Moreover, using Excel for project management and financial forecasting can streamline your workflow. With more accurate data, you can plan with confidence and adapt to changes quickly. Conditional formatting and dynamic charts make your data easier to understand. These tools help you communicate ideas clearly and support your plans.
Excel’s versatility allows you to create templates that make repeated tasks simpler. Additionally, you can save time and reduce mistakes by automating routine work. When you use Macros and VBA, repetitive tasks become easier to handle. As a result, you spend less time fixing data and more time on decision-making.
Learning advanced Excel also helps you track key business metrics. You can measure what matters most and respond to trends in real time. This gives you an edge in a competitive environment. Therefore, investing in these skills is a smart choice for any professional.
Ultimately, learning Excel gives you tools that support growth and success. The more you use these features, the more they become a natural part of your daily work. So, start exploring advanced features to see the benefits for yourself. You’ll find that Excel has the flexibility and power you need to drive progress.