 Excel remains one of the most widely used tools in business. If you want to stay productive, improve your Excel skills. It’s not only about entering numbers or creating totals. Excel can support planning, reporting, analysis, and team collaboration across your entire workflow.
Therefore, even a few new skills can reduce errors and save time. You might already know how to format cells or build simple formulas. However, there is a lot more value in learning advanced functions, building dashboards, and automating tasks. Additionally, knowing how to apply these tools to real business problems gives you a clear advantage.
Many professionals learn Excel on the job without formal training. This leads to habits that work but don’t scale well. Therefore, you might spend more time than necessary on tasks that Excel can automate. Additionally, you may not realize what the tool can do until you see it in action.
The Master Excel course helps you close that gap. It moves beyond the basics and shows how to apply each skill with purpose. You won’t be memorizing functions for the sake of it. Instead, you’ll use templates, real data, and projects to build skills that stick.
Additionally, the course gives you tools to use immediately. You’ll build reports, create models, and set up repeatable processes that help your daily work. Therefore, the learning becomes practical from day one. With consistent practice, Excel can become one of the most useful tools you rely on.
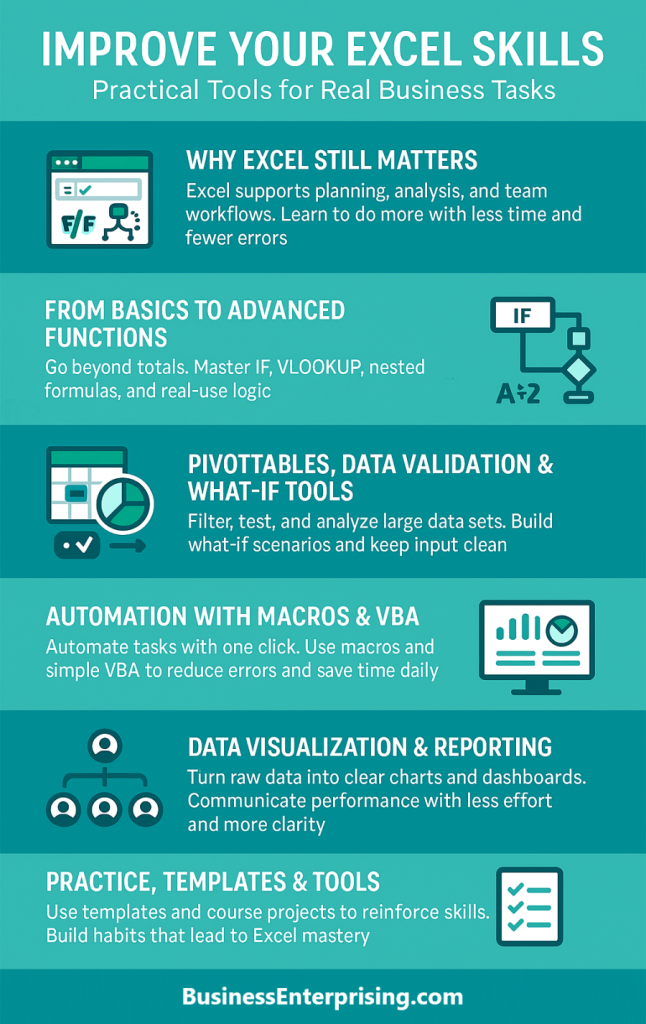
From Basics to Advanced Functions
Learning Excel often starts with the basics, but the real benefits come when you begin applying advanced functions. The course walks you through simple calculations first, then builds up to tools like IF statements and lookup functions. You learn each skill step by step, so you can apply it with confidence.
Therefore, once you understand basic formulas, you’ll move into conditional logic. The IF function helps you apply rules to your data. You can use it to flag values, apply discounts, or guide decisions. Additionally, lookup functions like VLOOKUP and HLOOKUP help you pull the right data from large tables.
Nested functions allow you to stack operations for more flexibility. For example, you can combine IF and VLOOKUP to build smarter spreadsheets. This means fewer manual steps and better accuracy across your files. Additionally, you’ll be able to troubleshoot errors faster because you know how the functions interact.
You don’t need to memorize every function. The course gives you clear examples and real business tasks to work through. As you apply these tools, you begin to improve your Excel skills in ways that save time and reduce risk.
Therefore, mastering these functions supports better forecasting, cleaner reporting, and faster problem solving. You’ll know what your numbers mean and what to do next. Additionally, these skills help you respond to changes with more speed and less guesswork.
By building up from the basics, you get the structure and logic you need. Excel becomes less about rows and columns and more about running your business with clarity.
PivotTables, Data Validation & What‑If Tools
When your data grows, it becomes harder to find what matters. PivotTables help you organize large sets into simple views. You can break data into categories and totals without changing the original file. Therefore, PivotTables are great for tracking sales, performance, or customer behavior across different time periods.
Additionally, drop-down menus help you control how people enter data. You can limit choices to a set list, which keeps your files consistent. This saves time and reduces the need to fix input errors later. You also avoid confusion by giving users clear options from the start.
Data validation works alongside drop-downs to keep your spreadsheets clean. For example, you can require numbers, prevent blanks, or block incorrect values. These small rules help you keep reports accurate and reliable. Therefore, when you’re sharing sheets with a team, validation helps everyone stay on the same page.
What-if tools help you test scenarios before making decisions. You can use the scenario manager to compare different plans side by side. Additionally, you can adjust variables like price, cost, or volume to see how they impact your outcome. This helps you avoid surprises later.
These features let you plan with more confidence and less stress. When you improve your Excel skills, you don’t need to build separate files for every option. You work smarter with what you already have. Additionally, your spreadsheets become tools that support decision-making, not just storage for data.

Automation & Macros/VBA for Efficiency
Manual tasks slow down your workflow and increase the chance of mistakes. Macros help you automate those tasks with a single click. You can record a series of actions and replay them when needed. Therefore, instead of repeating the same steps daily, you finish them in seconds.
Additionally, Excel’s built-in macro recorder makes it easy to start without coding. You perform the task once, and Excel remembers what you did. This works well for formatting, sorting, or exporting reports. It also keeps your process consistent each time.
If you want more control, you can write simple VBA scripts. VBA lets you create custom instructions for Excel to follow. For example, you can build a tool that cleans data, generates reports, or sends alerts. These scripts help you manage complex tasks without using outside software.
Therefore, when you use automation, your files become more efficient. You don’t have to fix repetitive errors or worry about skipped steps. Additionally, you free up time to focus on higher-value work. You gain more from your data while spending less time maintaining it.
When you improve your Excel skills, automation adds real value. Macros and VBA take pressure off your team. Additionally, they reduce risk by keeping your workflow consistent. You don’t need to know advanced programming. Start small and build as you go.
Excel gives you the tools. With a little practice, you can turn routine tasks into smart systems. You work faster, make fewer mistakes, and avoid repeating the same actions each week.
Data Visualization & Reporting
Excel gives you clear ways to turn raw numbers into visuals that tell a story. Charts and graphs make reports easier to read. Instead of scanning rows of data, you can spot trends with a quick glance. Therefore, visuals help you explain results without extra explanation.
Additionally, dashboards combine charts and tables in one place. You can track sales, costs, or marketing results on a single sheet. This helps you stay focused on what matters most. Dashboards save time and reduce the need to jump between files.
You can also use visual tools to monitor KPIs. Excel lets you build scorecards that update automatically. Therefore, you spend less time calculating and more time reviewing results. Additionally, color-coded charts help you spot missed targets or growing risks before they cause problems.
When you improve your Excel skills, reporting becomes more useful. You can highlight key changes and support your message with clean visuals. Additionally, these reports work well for teams. Everyone sees the same numbers in the same format, which improves communication.
Charts also support competitive analysis. You can compare your performance against industry benchmarks or past results. This helps you stay aware of where you stand and where you’re improving. Therefore, visuals add context that’s hard to get from numbers alone. Your reports reflect how you think. When they are clean, clear, and well-structured, they build confidence. Excel makes it easy to share updates that others can understand without needing your input.
Collaboration, Sharing and Workflow Integration
Excel supports more than individual work. It also helps teams stay aligned. Sharing workbooks allows everyone to view and update the same file. This keeps your data in one place and avoids version confusion. Therefore, updates happen in real time, and no one needs to chase old emails.
Additionally, Excel lets you track changes. You can see who made edits, when they were made, and what was changed. This helps you review work quickly and avoid redoing tasks. It also improves accountability across your team.
Co-authoring adds another layer of flexibility. You and your team can work in the same file at the same time. Therefore, collaboration feels smoother, even when working remotely. Additionally, you reduce the time lost from waiting on others to finish their part.
Excel also integrates well with other tools and formats. You can export data into PDFs, connect with online forms, or pull from other sources. This makes it easier to share reports with people outside your team. Additionally, you can copy visuals or tables into slides or emails without extra formatting.
When you improve your Excel skills, these features become part of your routine. You stop wasting time on file transfers or version tracking. Instead, you focus on the work itself. Additionally, you help others stay organized by keeping workflows consistent and easy to follow.
Good collaboration comes from simple systems that support clear communication. Excel gives you tools to make teamwork feel less chaotic and more connected.
Hands‑On Practice, Templates & Tools to Build Mastery
Learning Excel is more effective when you work with real examples. Templates and tools give you a head start without starting from scratch. These resources help you focus on learning rather than setup. Therefore, you can apply functions, test logic, and build reports with real business tasks in mind.
Additionally, downloadable cheat sheets give you quick reminders. You don’t have to memorize every formula or rule. You can refer to a guide while building your project. This keeps you moving without getting stuck on small details. It also helps you stay accurate as you learn.
Course projects reinforce what you’ve practiced. You get to apply functions, formatting, and visuals in a way that feels natural. These projects are designed to reflect real business situations. Therefore, you get to practice in a way that prepares you for actual work. Additionally, this type of hands-on learning helps you spot gaps early.
When you improve your Excel skills, repetition matters. Working with live files, building templates, and applying formulas keeps the concepts fresh. Additionally, you begin to build habits that reduce errors and improve speed. You don’t have to relearn functions each time. They become part of your process.
Tools and templates are not shortcuts. They are structured aids that help you learn more by doing more. Therefore, the more you apply your skills, the more confident you become. You gain control over your data and how you use it every day.
Conclusion
Excel is more than a tool for organizing numbers. It supports how you plan, report, and make business decisions. When used well, it saves time and increases accuracy. Therefore, it makes daily tasks feel more manageable and less repetitive.
Additionally, strong Excel skills help you respond faster when things change. You can test ideas, track results, and share updates without rebuilding from scratch. Each file becomes more than a spreadsheet. It becomes a system you can rely on.
Practice is what helps you improve your Excel skills. Templates, real data, and repeat use build confidence over time. Therefore, instead of feeling stuck, you begin to solve problems faster. You also become more consistent in how you structure your work.
Additionally, learning tools like macros, dashboards, and data validation help you get more out of each file. These features let you manage details without losing sight of the big picture. They also help your team stay aligned and productive.
Excel rewards repetition. Each time you use a formula or fix a layout, you improve. The effort adds up. Therefore, treat Excel like any other business process. The more you apply it, the more value it brings to your work. Consistency, structure, and automation all come from using Excel with purpose. When your files are organized and your reports are clear, your decisions follow the same pattern. You build trust in your data and your process.