 The Data Analysis ToolPak in Excel makes handling data simpler for business professionals who work with numbers every day. This add-in provides ready-to-use tools for tasks like summarizing trends, running regressions, and building charts. Therefore, it saves time while offering quick insights from your spreadsheets.
Additionally, the ToolPak is built into Excel, so you don’t need to buy extra software. You just need to enable it through the Add-Ins menu. After that, it appears in the Data tab and becomes part of your daily workflow. That ease of access makes it useful for both new and experienced users.
However, the value goes beyond convenience. You can use it for real business tasks like performance tracking and cost analysis. Therefore, the ToolPak becomes more than a technical feature; it becomes a decision-making asset. You work smarter by using data, not just guessing.
Moreover, the ToolPak helps you apply simple math to complex problems. You can calculate averages, test trends, or visualize results without much setup. That means less confusion and more action. It also builds your skills over time by making analysis part of your routine.
By starting with the ToolPak, you get a feel for data analysis without needing to be a statistician. The tools are labeled clearly and organized for ease of use. Therefore, you can focus on what matters: using data to improve results. Overall, the Data Analysis ToolPak in Excel helps you gain control of your numbers. It gives you a foundation for better thinking, clearer reporting, and smarter choices every day.
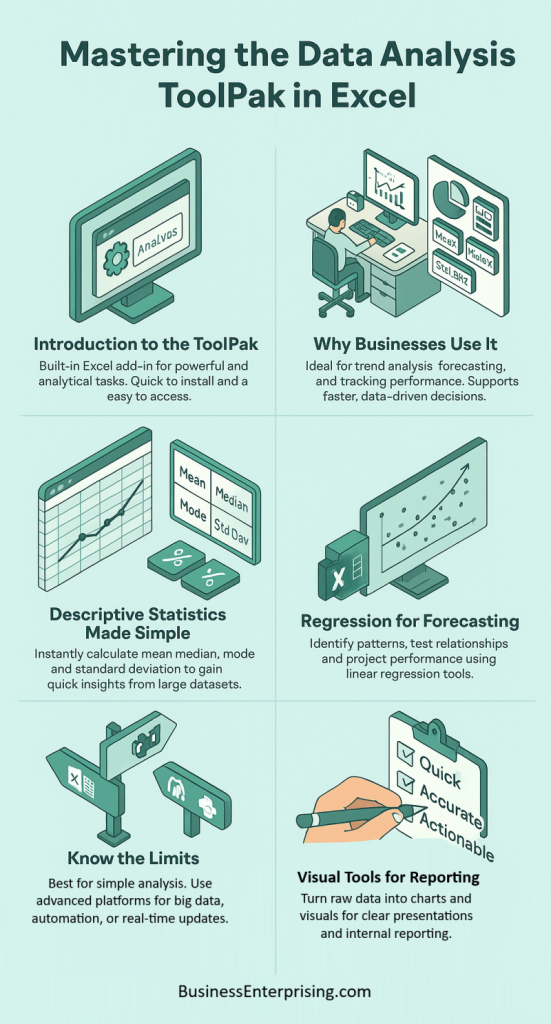
Introduction to the Data Analysis ToolPak
The Data Analysis ToolPak in Excel helps you run advanced analytics without writing formulas. It is a built-in add-in available in most versions of Excel. You can use it for statistical functions, forecasting, and basic data modeling. Many users are unaware it exists or that it must be activated.
To enable the ToolPak, start by clicking the File tab. Then choose Options and select Add-ins. From there, click Go next to Excel Add-ins. Check the box for Analysis ToolPak and press OK. The ToolPak will now appear under the Data tab.
Once enabled, you will find a new button labeled Data Analysis. It opens a list of tools like regression, histograms, and descriptive statistics. These features are designed to work with data in spreadsheet format. Therefore, you can apply analysis without switching software.
Additionally, the ToolPak simplifies complex processes. Instead of writing long formulas, you follow step-by-step prompts. You select your data, choose the function, and Excel completes the task. This saves time and increases accuracy.
However, the ToolPak only works on static data ranges. It does not update automatically when you change your source data. Therefore, you must re-run analysis if your inputs change. Knowing this helps you avoid confusion or reporting errors.
The ToolPak is ideal for small business reporting and educational use. While it lacks the power of more advanced tools, it meets the needs of most Excel users. The Data Analysis ToolPak in Excel gives you a fast way to analyze data without specialized training. With a few clicks, you turn raw data into meaningful summaries. That can help you find trends, test assumptions, or support better business decisions.
Why Businesses Use the ToolPak for Data Analysis
Many businesses rely on data to make decisions. However, raw data alone means little without the right tools to analyze it. That’s why many use the Data Analysis ToolPak in Excel. It allows business owners and teams to evaluate trends, forecast outcomes, and review performance with minimal setup.
The ToolPak supports better planning by turning past results into clear reports. Therefore, it helps you spot patterns over time. For example, sales managers use it to see seasonal trends. Additionally, you can forecast future performance using regression tools. This lets you plan inventory, staffing, or campaigns with more precision.
You can also track how your team or products perform. The ToolPak makes it easy to measure averages, changes, and variation. These summaries help you make comparisons and set benchmarks. Therefore, your reports become more meaningful and easier to explain.
Additionally, the ToolPak supports fast decision-making. You don’t have to build complex formulas or use external software. Instead, you run an analysis directly in Excel. The output includes charts and summary tables that you can share with others. That saves time and builds clarity.
However, the value lies not just in the tool but in how you use it. When combined with consistent data collection, the ToolPak becomes a smart way to stay informed. You respond faster to problems and spot opportunities sooner. The Data Analysis ToolPak in Excel provides practical support for daily business analysis. It gives you the power to turn numbers into direction. That makes your decisions more confident and your results more predictable.

Descriptive Statistics: Quickly Summarize Large Data Sets
Descriptive statistics help you make sense of large sets of numbers. They give you quick insights without much effort. The Data Analysis ToolPak in Excel makes this process simple. You select your data, choose the tool, and get a clear summary in seconds.
The most common statistics include the mean, median, and mode. These show you the average, middle, and most frequent values. Therefore, you can quickly spot trends or outliers in your data. Additionally, standard deviation shows how spread out the values are. This tells you how consistent your numbers are across entries.
You don’t need to write formulas for each value. Instead, the ToolPak handles all the calculations for you. It presents the results in a clean output table. Therefore, you can focus on what the numbers mean, not how to get them. This saves time and reduces errors.
Additionally, using descriptive statistics helps you make better decisions. For example, if you track customer purchases, the mean shows what people usually spend. The mode might show which product sells the most. You can then adjust pricing or stock based on these facts.
However, statistics are most useful when you compare them over time. By repeating the analysis regularly, you track progress and spot changes. The ToolPak makes that repeatable and consistent. Therefore, you keep your insights up to date.
The Data Analysis ToolPak in Excel makes descriptive analysis both quick and practical. You get useful information without doing the math yourself. That helps you focus on improving your business with more clarity and less guesswork.
Regression Analysis for Forecasting and Strategy
Regression analysis helps you understand how one variable influences another. It’s a reliable way to spot trends and make forecasts. The Data Analysis ToolPak in Excel includes a simple tool for linear regression. You just select your data and run the analysis.
Therefore, you can see how sales change with advertising spend or how revenue reacts to pricing shifts. Additionally, the output includes coefficients, R-squared values, and intercepts. These tell you how strong the relationship is and help you predict future results.
You don’t need advanced math to use the tool. The ToolPak creates a summary that’s easy to read. However, you still need to decide which variables to test. For better results, choose data that reflects real conditions in your business. That improves accuracy and avoids misleading trends.
Additionally, regression results can guide your strategy. If the model shows a strong link, you may want to invest more in that area. For example, if ad spend clearly drives sales, you could allocate more budget there. Therefore, this analysis supports smarter choices.
You can also use regression to check assumptions. If something doesn’t drive performance, you stop wasting time on it. This keeps your strategy focused and efficient. Over time, you refine your approach based on what the data actually shows.
The Data Analysis ToolPak in Excel makes regression analysis accessible to everyone. You gain insight without coding or external software. That makes it a practical tool for planning, budgeting, and business growth based on clear evidence.
Using Histograms and Other Visual Tools
Visual tools make your data easier to explain and understand. The Data Analysis ToolPak in Excel includes built-in options like histograms. These charts show frequency distributions, which help you spot patterns quickly. Therefore, they’re useful for presentations and internal reviews.
Additionally, histograms can reveal outliers and skewed data. You gain insight into how values group or spread. That helps when making decisions based on customer behavior or performance scores. However, visuals are only helpful if used clearly. The ToolPak lets you format charts so they look clean and professional.
Moreover, visuals support better communication. Your team may not follow raw data, but they understand a clear chart. Therefore, using graphs makes your meetings more productive. You can show trends, compare results, and highlight key points without long explanations.
The ToolPak also includes scatter plots and line charts. These tools work well with regression and time-based analysis. Additionally, these visuals help you show how one metric relates to another. With a few clicks, your data becomes a visual story.
When you share reports, graphs can drive your message. You highlight what matters and reduce confusion. Therefore, your analysis gets taken more seriously. People trust results they can see and understand. Presentations become smoother and decisions come faster.
The Data Analysis ToolPak in Excel gives you easy access to these tools. You don’t need separate software to make impactful visuals. With basic setup, your data becomes more useful and your communication improves. That supports smarter decisions throughout your business.
Limitations and When to Use More Advanced Tools
The Data Analysis ToolPak in Excel works well for basic business needs. However, it has limits that may affect deeper analysis. For example, the ToolPak cannot process large datasets or handle real-time inputs. It also lacks advanced visualization options and automation features.
Therefore, as your business grows, your tools may need to grow too. Additionally, if your data becomes more complex, Excel may slow down or crash. These issues cause delays and reduce confidence in your results. For regular users, this can become frustrating and time-consuming.
Power BI offers more power for reporting and dashboards. It connects to multiple data sources and refreshes data automatically. Therefore, your reports stay updated without manual input. Additionally, Power BI allows real-time tracking and interactive visuals, which Excel cannot provide.
Python is another useful step forward. It helps you automate tasks and run advanced models. Therefore, if you handle predictive analytics or large-scale data mining, Python offers more control and flexibility. However, it does require some coding skill.
Dedicated analytics platforms also provide better collaboration. You can manage roles, track user activity, and share reports across teams. Additionally, these platforms often include machine learning options and integrations that Excel lacks.
However, not every business needs to switch tools immediately. If your current reports are small and clear, the ToolPak may be enough. But once data size or complexity grows, upgrading becomes a smart decision. By understanding the limits of the Data Analysis ToolPak in Excel, you make better choices. You decide when to keep things simple or move to stronger platforms.
Conclusion
The Data Analysis ToolPak in Excel offers a practical way to handle business data without extra software. It works well for everyday tasks like tracking performance, spotting trends, and running basic forecasts. Therefore, it gives small business owners and teams a useful starting point for making informed choices.
Additionally, the ToolPak is easy to access. Most Excel users can install it within minutes and start analyzing data right away. You do not need advanced skills or programming knowledge. That makes it a helpful tool for anyone working with numbers.
However, you may outgrow it as your needs expand. Larger data sets, real-time reporting, or complex modeling often require more advanced tools. Therefore, it is smart to know when to shift to something like Power BI or Python. Each option offers features that go beyond what Excel can do.
Still, you do not have to move all at once. You can keep using the ToolPak for simpler projects while exploring better tools for new goals. That balance helps you stay efficient without wasting time or money.
Additionally, using the ToolPak builds your skills. As you practice with data, you become more confident in your analysis. That skill carries over to more advanced tools when you make the switch.
Therefore, the Data Analysis ToolPak in Excel remains a smart entry point. It gives you the power to analyze data, make decisions, and build stronger business habits. Over time, those habits can lead to more efficient operations and better results.