 Learning how to use excel tables can make a significant difference in the way you manage your data. Tables allow you to organize, analyze, and present information more effectively than regular ranges. Therefore, you gain both clarity and efficiency when working with large or complex datasets.
Additionally, Excel tables provide built-in features that adapt as your data changes. They expand automatically, apply consistent formatting, and simplify calculations across entire columns. As a result, you spend less time on manual adjustments and more time focusing on meaningful insights. Furthermore, tables connect smoothly with charts, PivotTables, and dashboards, giving you reliable tools for analysis.
Another benefit of tables is how they improve readability. Structured references replace cell addresses with column names, making your formulas easier to write and understand. Therefore, your spreadsheets become more transparent for you and anyone else reviewing your work. Moreover, this structure reduces errors that often occur when working with raw data ranges.
When you adopt tables into your workflow, you strengthen both accuracy and presentation. By using these features consistently, you build spreadsheets that adapt naturally to growth. Additionally, tables keep your work organized, professional, and easy to manage over time.
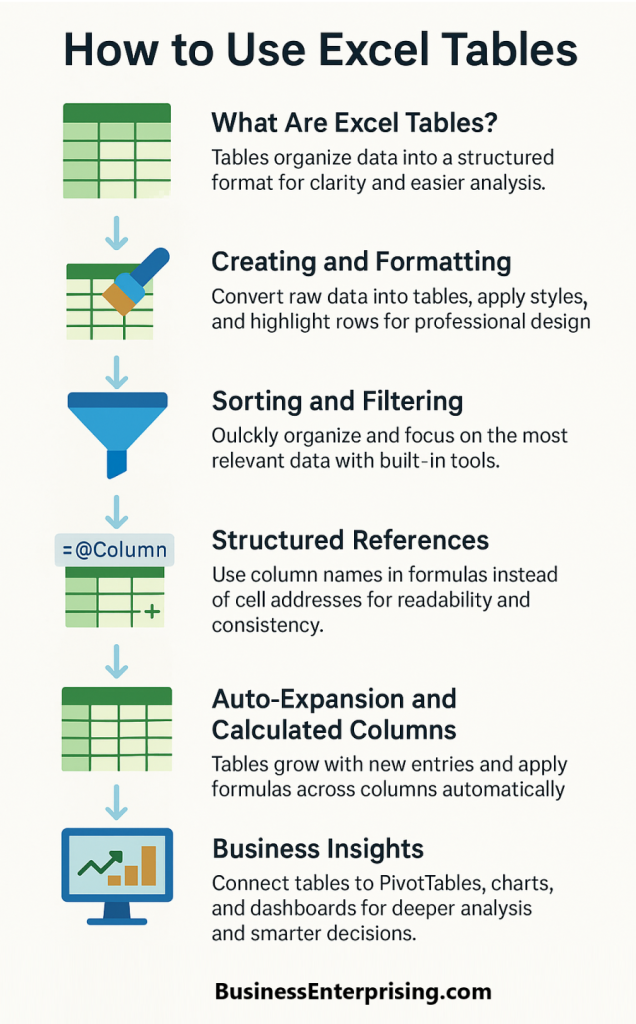
What Are Excel Tables and Why They Matter
Excel tables are a simple but powerful feature that can make your data easier to manage. When you convert a normal data range into a table, Excel automatically adds functionality that saves you time and effort. A table allows you to work with your data in a structured way, making it more efficient to analyze and update.
Many people work with basic ranges of numbers and text, but those ranges lack flexibility. A regular range requires manual formatting and adjustments as your dataset grows. However, an Excel table automatically expands when you add new rows or columns. This feature reduces repetitive tasks and keeps your data organized without constant reformatting.
Additionally, Excel tables provide built-in sorting and filtering tools. You can quickly narrow down large sets of information with a few clicks. As a result, your ability to analyze information improves without needing advanced formulas. Furthermore, the table design options allow you to apply consistent formatting that highlights key data points clearly.
Another advantage comes from how formulas behave inside a table. Instead of referencing confusing cell addresses, Excel uses structured references based on column names. This makes your formulas easier to read and maintain. Therefore, your work becomes more transparent for you and anyone reviewing your spreadsheet.
Understanding how to use excel tables can make a noticeable difference in your daily business tasks. Tables connect smoothly with charts, PivotTables, and dashboards, giving you better insights from the same data. By using tables, you can keep your spreadsheets organized, flexible, and more professional without adding complexity.
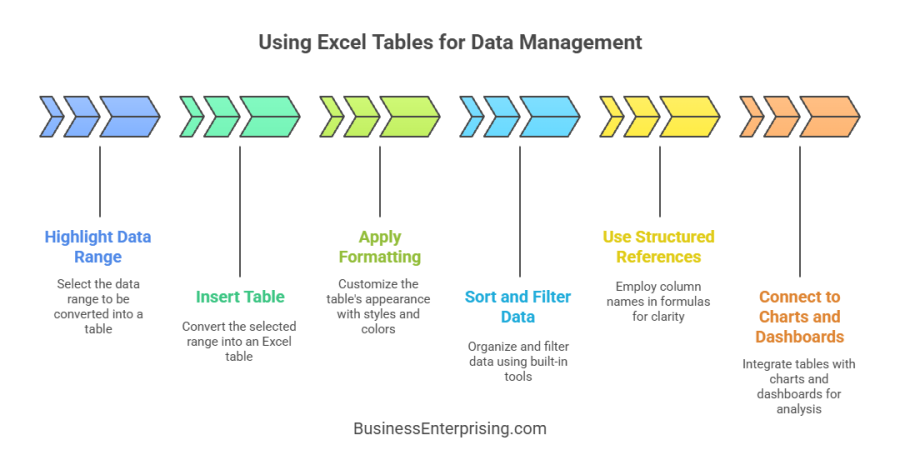
Creating and Formatting Excel Tables
Creating a table in Excel starts with highlighting your raw data. After selecting the range, you insert a table from the toolbar. Excel instantly applies a default format and gives your data its own structured layout. This simple step transforms an ordinary list into something far easier to work with.
Once your table is created, you can adjust the design to match your needs. For example, you can select from built-in table styles to give your data a professional appearance. Additionally, alternating row colors make large datasets easier to scan quickly. Therefore, you reduce errors and spend less time searching for information.
You can also customize column headers and resize them for clarity. When you rename columns, the table automatically updates formulas that reference them. As a result, your spreadsheets remain accurate without extra editing. Furthermore, you can add a total row with one click, giving you instant calculations like sums and averages.
Formatting options go beyond style. You can apply filters, sort data, or highlight important details without redoing the entire layout. Moreover, when you add new rows or columns, the table expands automatically. This keeps your data structured without repetitive formatting work.
Learning how to use excel tables helps you create worksheets that are more organized and functional. By combining strong formatting with flexible features, you build tools that save you time while presenting information clearly. Tables provide both structure and style, making your spreadsheets look polished and easier to manage.

Sorting and Filtering Data Easily
Sorting and filtering are two of the most valuable features built into Excel tables. When you convert your data into a table, Excel automatically adds filter arrows to each column header. These allow you to organize information quickly without writing extra formulas. With a few clicks, you can reorder values alphabetically, numerically, or by date.
Additionally, filters help you focus on only the rows you need. For example, you can display sales from one region while hiding the rest. As a result, you spend less time scanning large datasets and more time reviewing meaningful details. Furthermore, multiple filters can be applied at once, giving you precise control over what you see.
Another benefit is that sorting and filtering tools stay active as your table grows. When you add new data, the filters expand automatically. Therefore, your table remains consistent and functional without additional formatting work. Moreover, you can clear or adjust filters anytime, keeping your view flexible while maintaining the original dataset.
You can also use sorting and filtering with custom options. For instance, highlight the top-performing products or show records above a certain value. These features transform your table into a dynamic tool for analysis. Therefore, you reduce errors and gain faster insights from the same data.
Learning how to use excel tables for sorting and filtering makes managing information easier. By taking advantage of these built-in tools, you organize your spreadsheets efficiently and make your data more accessible. Tables provide a clean, structured way to work with growing information while keeping your analysis clear.
Using Structured References in Formulas
Structured references are one of the most practical benefits of Excel tables. Instead of using cell addresses like A1 or B2, your formulas can reference column names. This makes them much easier for you to understand and maintain. Therefore, your worksheets become clearer, especially when you share them with others.
Additionally, structured references update automatically as your table grows. When you add new rows, the formulas expand without requiring adjustments. As a result, your calculations stay accurate with less manual effort. Furthermore, if you rename a column, Excel updates all related formulas instantly. This reduces errors and saves you time when making changes.
You can also write formulas more quickly with structured references. For example, referencing a column name directly is faster than searching for the right range. Therefore, you spend less energy double-checking ranges and more time focusing on analysis. Moreover, these references make your spreadsheets more user-friendly for others who may not know the data layout.
Another advantage is how tables apply formulas consistently. When you enter a formula in one row, Excel automatically fills it down the column. This creates consistent calculations without repetitive work. Additionally, structured references keep formulas readable by linking them directly to the data they summarize.
Learning how to use excel tables with structured references can make a big difference in your workflow. By adopting this method, you create spreadsheets that are cleaner, more reliable, and easier to manage. With these tools, you reduce confusion and simplify your daily tasks.
Dynamic Features: Auto-Expansion and Calculated Columns
One of the most useful features of Excel tables is their ability to expand automatically. When you type new data beneath a table, Excel includes it right away. Therefore, you avoid the hassle of reapplying formats or formulas each time your dataset grows. This makes your work more efficient and keeps everything consistent.
Additionally, calculated columns are a powerful part of tables. When you enter a formula in one cell, Excel applies it across the entire column. As a result, every row follows the same logic without you needing to copy and paste. Furthermore, if your table expands, the formula continues to apply automatically to new entries.
This automation improves both speed and accuracy. Instead of manually tracking where formulas stop, you can rely on the table structure. Therefore, you reduce errors and keep your data reliable over time. Moreover, updating a formula in one cell updates the entire column instantly, which makes maintenance much easier.
Another benefit is that formatting also carries forward as your table grows. New rows adopt the same style, colors, and filters as the existing ones. Consequently, your table looks clean and professional without extra work. This allows you to focus more on analysis and less on manual adjustments.
Learning how to use excel tables with auto-expansion and calculated columns can save you time every day. By relying on these dynamic features, you build spreadsheets that adapt naturally to your data. These functions give you greater control while reducing repetitive tasks, making your tables more practical and dependable.
Connecting Excel Tables to Business Insights
Excel tables do more than organize data, they also connect seamlessly to tools that help you analyze information more effectively. When you link a table to a PivotTable, the data updates automatically as new rows are added. Therefore, you can refresh your PivotTable and see the latest results without rebuilding it. This integration saves time and keeps your analysis accurate.
Additionally, tables work well with charts. When your dataset grows, the chart expands to include the new values automatically. As a result, you avoid manual adjustments and always display a complete picture. Furthermore, formatting from the table carries into the chart, which makes your visuals clear and consistent.
You can also connect tables to dashboards for an even stronger impact. Dashboards often combine multiple charts and summaries into one view. By using tables as the foundation, you keep everything linked to a single source of truth. Therefore, your dashboards stay reliable and easy to update as data changes.
Another advantage is the clarity that structured references bring when building reports. Column names make formulas within PivotTables and charts easier to understand. Consequently, you spend less time troubleshooting and more time interpreting results. This makes collaboration smoother when others need to review your work.
Learning how to use excel tables in combination with these tools strengthens your decision-making process. By building connections between tables, PivotTables, charts, and dashboards, you transform raw information into insights. These features allow you to analyze performance, identify patterns, and guide your business with greater confidence.
Conclusion
Excel tables bring structure and efficiency to your data, making everyday tasks easier to handle. By converting ranges into tables, you gain features that save time while improving accuracy. Therefore, your spreadsheets become tools that work harder for you.
Additionally, tables adapt naturally as your information grows. Auto-expansion, consistent formatting, and calculated columns reduce repetitive work. As a result, you focus on analysis instead of maintenance. Furthermore, structured references make your formulas cleaner and easier to understand, even when multiple people use the same file.
Another strength is how tables connect with charts, PivotTables, and dashboards. These links provide insights that guide better business decisions. Therefore, your data transforms into information that supports action. Moreover, updates happen automatically, so you spend less time refreshing and more time interpreting results.
When you learn how to use excel tables, you gain more control over your data without adding complexity. By combining clarity, flexibility, and automation, tables improve both the look and the function of your spreadsheets. Consequently, your work becomes more reliable and professional.
Using tables consistently across your projects will help you build stronger habits in Excel. Additionally, these features create efficiency that extends to your entire workflow. By applying them regularly, you set yourself up for better analysis and smarter decision-making.
Online Course: Learn Excel