 Learning spreadsheet skills can transform how you manage data and make decisions. An Excel tutorial for beginners gives you a clear starting point. You gain confidence as you move through simple tasks. You also begin to see how data supports everyday business choices.
First, you notice that Excel organizes information in a structured way. Then, you start using it to track expenses, sales, or client details. As you continue, patterns become easier to spot. Because of this, you make faster and better decisions.
Moreover, Excel helps you reduce manual work. You spend less time calculating numbers by hand. Instead, you rely on built-in tools that handle calculations instantly. As a result, your workflow becomes more efficient.
At the same time, you build skills that apply across many industries. You can use Excel in finance, marketing, operations, or project management. Therefore, learning these basics gives you a strong advantage.
While the software may seem complex at first, you can learn it step by step. You do not need technical experience to begin. Instead, you focus on simple actions and build from there.
Because consistency matters, practice plays a key role in your progress. Each time you use Excel, your confidence grows. Eventually, you move from basic tasks to more advanced features.
By following a structured approach, you avoid confusion and wasted effort. You learn the right way from the start. This leads to better results and fewer mistakes over time.
As you continue reading, you will learn how to use Excel effectively for business tasks.
Getting Started with Excel: Understanding the Interface and Core Features
When you open Excel for the first time, the interface may seem unfamiliar. However, you quickly recognize patterns as you explore each section. The Ribbon sits at the top and organizes tools into clear tabs. Because of this layout, you can access commands without searching endlessly.
Next, you work with worksheets that store your data. Each worksheet contains rows and columns that form cells. As you click different cells, you begin to understand how data is structured. Then, you see how easy it is to move between sections.
In an Excel tutorial for beginners, you learn how to navigate efficiently. You use the mouse and keyboard shortcuts to move faster. As a result, your workflow becomes smoother and more controlled.
Moreover, you discover how to open, save, and manage files. This step helps you keep your work organized from the start. Because file management matters, you avoid losing important data.
At the same time, you begin to use basic tools like copy, paste, and undo. These simple actions reduce errors and save time. Then, you start to see how small features make a big difference.
As you continue, you explore the Quick Access Toolbar. This feature lets you save frequently used commands. Therefore, you complete tasks faster with fewer clicks.
Because the interface stays consistent, your learning builds naturally. Each tool connects to the next step in your workflow. Over time, you move through tasks with confidence and clarity.
Entering and Formatting Data for Business Use
Once you understand the interface, you begin entering data into cells. You type text, numbers, and dates based on your needs. As you add more information, organization becomes important. Therefore, you focus on keeping your data clean and structured. In an Excel tutorial for beginners, you learn how formatting improves readability. You adjust font size, color, and alignment to highlight key details. Because of these changes, your spreadsheets become easier to understand.
Next, you format numbers to match business standards. You use currency, percentages, and date formats where needed. As a result, your reports appear more professional and accurate. Moreover, you apply cell borders and shading to separate sections. This step helps you group related data clearly. Then, you notice how visual structure supports faster analysis.
At the same time, you learn to edit data quickly. You correct mistakes without rewriting entire sections. Because of this flexibility, your workflow stays efficient. You also use features like autofill to repeat patterns. For example, you extend dates or numbers across rows. Therefore, you reduce manual input and save time.
As you continue, you see how proper formatting supports decision making. Clear data leads to better insights. Because your spreadsheets remain organized, you avoid confusion and errors. Over time, these habits become part of your daily workflow. You build spreadsheets that communicate information clearly and effectively.
Essential Excel Formulas and Functions Every Beginner Should Know
After entering data, you begin using formulas to perform calculations. These formulas help you work with numbers quickly and accurately. As a result, you spend less time doing manual math. In an Excel tutorial for beginners, you start with basic functions like SUM and AVERAGE. These functions calculate totals and averages in seconds. Because of this, you gain immediate value from your data.
Next, you explore functions like MIN and MAX. These tools help you identify the lowest and highest values. Then, you use this information to analyze performance or trends. Moreover, you learn how to write formulas using cell references. Instead of typing numbers, you link to existing data. As a result, your calculations update automatically when data changes.
At the same time, you begin using logical functions like IF. This function allows you to create simple rules within your spreadsheet. Therefore, you can categorize or evaluate data based on conditions. Because formulas follow a consistent structure, you build confidence quickly. You practice writing them step by step. Then, you test them to confirm accuracy.
As you continue, you see how formulas connect different parts of your spreadsheet. They turn raw data into meaningful insights. Because of this, your work becomes more valuable and efficient. Over time, these functions form the foundation of more advanced analysis. You develop skills that support better business decisions.
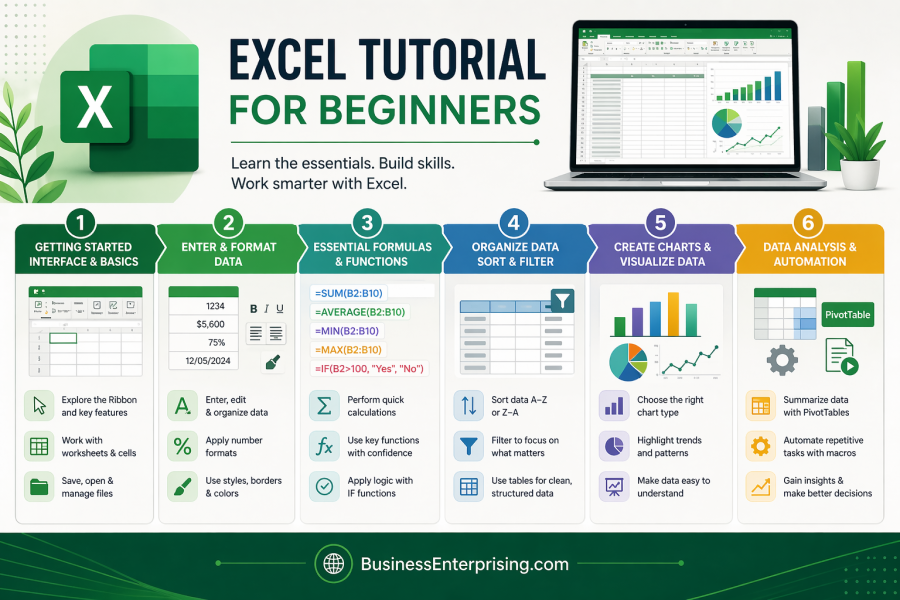
Organizing Data with Tables, Sorting, and Filtering
As your data grows, organization becomes more important. You need a clear structure to manage information effectively. Therefore, you start using tables to organize your data. In an Excel tutorial for beginners, you learn how tables improve clarity. Tables group related data into a defined format. Because of this, your spreadsheet becomes easier to read and manage.
Next, you apply sorting to arrange data in a logical order. You sort numbers, dates, or text based on your needs. As a result, you quickly identify patterns or trends. Moreover, you use filtering to focus on specific information. Filters allow you to hide data that is not relevant. Then, you analyze only the details that matter.
At the same time, you learn how to combine sorting and filtering. This approach gives you more control over your data. Because of this, you make faster and more informed decisions. You also see how tables automatically expand as you add new data. This feature keeps your structure consistent. Therefore, you avoid errors that come from manual updates.
As you continue, you notice how organized data improves collaboration. Others can understand your spreadsheets quickly. Because everything follows a clear format, communication becomes easier. Over time, these tools help you manage larger datasets with confidence. You build systems that support accurate and efficient analysis.
Creating Charts and Visualizing Data for Better Insights
After organizing your data, you begin turning it into visual formats. Charts help you present information in a clear and engaging way. Because of this, others understand your data more easily. In an Excel tutorial for beginners, you learn how to create basic charts. You choose from options like bar, line, and pie charts. Then, you match the chart type to your data.
Next, you customize your charts to improve clarity. You adjust titles, labels, and colors to highlight key points. As a result, your visuals communicate information effectively. Moreover, you see how charts reveal trends that numbers alone may hide. Patterns become visible at a glance. Therefore, you make quicker decisions based on clear insights.
At the same time, you learn to update charts as your data changes. Because charts link directly to your data, updates happen automatically. This keeps your reports accurate without extra work. You also begin using charts in presentations and reports. Visual data supports your message and strengthens your communication. Because of this, your work becomes more persuasive.
As you continue, you understand how visualization supports business strategy. Clear visuals help teams align around key insights. Then, decisions become more focused and effective. Over time, charts become a regular part of your workflow. You present data in a way that drives understanding and action.
Introduction to Data Analysis Tools and Automation
Once you feel comfortable with basic features, you explore data analysis tools. These tools help you work with larger datasets more efficiently. Because of this, your capabilities expand quickly. In an Excel tutorial for beginners, you often start with PivotTables. PivotTables summarize data and highlight key insights. Then, you use them to analyze trends and performance.
Next, you learn how to group and filter data within PivotTables. This allows you to focus on specific segments. As a result, your analysis becomes more targeted. Moreover, you begin exploring simple automation features. For example, you record macros to repeat tasks. Because of this, you reduce repetitive work and save time.
At the same time, you understand how automation improves consistency. Tasks follow the same steps every time. Therefore, errors become less frequent. You also see how these tools support business reporting. You create summaries that help guide decisions. Because your data is organized and analyzed, your insights become more reliable.
As you continue, you build confidence using advanced features. You move beyond manual processes and rely on smarter workflows. Then, your productivity increases steadily. Over time, these tools bridge the gap between beginner and intermediate skills. You gain the ability to manage complex data with ease.

FAQ
| Question | Answer |
|---|---|
| What is the best way to start learning Excel? | The best way to start is by learning the interface and basic navigation. Focus on simple tasks like entering data and formatting cells. Then, practice regularly. Over time, you build confidence and move into formulas and data organization. |
| How long does it take to learn Excel basics? | Most beginners can learn the basics within a few days of consistent practice. However, building confidence may take a few weeks. As you continue using Excel in real situations, your skills improve naturally and become more efficient. |
| Why are Excel formulas important for beginners? | Formulas allow you to automate calculations and reduce manual work. They also help you analyze data quickly. When you understand basic formulas, you can create more accurate reports and make better decisions based on your data. |
| Can Excel be used for business tasks? | Yes, Excel supports many business functions such as budgeting, reporting, and data tracking. It helps you organize information and identify trends. Because of this, many businesses rely on Excel for daily operations and decision making. |
| What should I learn after an Excel tutorial for beginners? | After completing an Excel tutorial for beginners, you should explore PivotTables, charts, and automation tools. These features help you analyze data more effectively. As you continue, you can move into advanced functions and more complex reporting techniques. |